Introduction
The visually impaired rely on non-visual senses, primarily hearing, to help them locate and identify objects within their immediate and distant environment. Although all of the senses are able to convey information pertaining to an ob ject (i.e. texture, temperature, and size), only the auditory system is capable of providing significant distance cues, which are coded primarily through intensity. The Sonic Pathfinder [2] and SonicGuide [3] are examples of the many Electronic Travel Aids (ETAs) which sonify range information allowing object detection/avoidance by the visually impaired user.
To determine the distance to an object, most ETAs emit an ultrasonic sound and measure the time it takes for the echo to return. Due to the wide panoramic field of view, small range and reflection artifacts inherent with sonar, the use of sonar based devices is limited to localising objects within an immediate and uncluttered environment [1]. They fail to provide sufficient resolution and artifact-free range data necessary for the perception of 3D space. Unlike sonar, laser ranging allows for a greater range. Its narrower beam and shorter wavelength combine to detect finer detail necessary for shape and pattern perception. A laser ranging device has been used by to provide range measurements for an autonomous robot [4].
Rather than object detection, which sonar is better suited for, we decided to examine the sonification of infrared range measurements in order to detect shapes and patterns (e.g. detection of corners, stairs, and depth discontinuities) in the user's environment.
The ultimate goal of our work is to develop a device that will enable the perception of 3D space by the visually impaired user.
Description
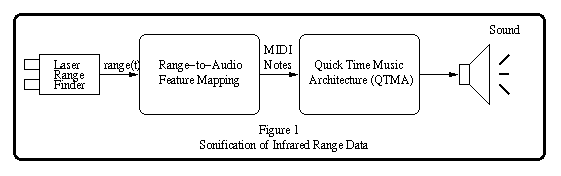
Figure 1 below illustrates the range data sonification process. The user will scan their environment and obtain range measurements with the laser range finder (LRF). Measurements are mapped to a particular feature in the audio domain (see below). As most people are familiar with the notes of the musical scale [2], one feature we experimented with is frequency in the form of MIDI (Musical Instrument Digital Interface) notes. Another feature experimented with is amplitude. Finally, t he MIDI note is output using one of the 128 instruments available with the Quick Time Music Architecture (QTMA) software synthesiser.
Two modes of operation have been defined. The proportional mode (range to audio feature mapping), provides the user with a general knowledge regarding both the close-by and distant surroundings through the detection of objects, doorways, depth discontinuities, etc. The derivative mode (temporal derivative of range to audio feature mapping), is used to obtain the greater detail necessary for shape and pattern detection.
The Mappings
We now elaborate on the various mappings used, summarised in table 1
below.
|
|
|
|||
|
|
|
|||
|
|
|
|
|
|
|
|
|
|
|
|
|
|
if d less than r:
F = kc-(d - r) a else F = F1 where: distance = d min.distance=r |
if D d
less than s:
F =kc-(D d - s)a else F = F1 where: max. distance=s |
|
|
Proportional Mode
While in the proportional mode, range measurements are mapped inversely to frequency using the logarithmic mapping. In addition to producing the most favourable results, it allowed for a perceived change in frequency throughout the ent ire distance range. Best results have been achieved when using the following constant values: k = 4000Hz, c = 2.718 ('e'), a = 0.15 and r = 0.3m. Optionally, the user may choose to alter the amplitude in conjunction with frequency using a modified version of the inverse square law (a = 125 and b = 0.3).
Depth discontinuity, or, a sudden change in depth, is defined as difference between the present and previous range measurement greater than a pre-defined value. Such information was conveyed to the user utilising one of the instruments of the QTMA including drum cymbals, saxophone and accordion ensuring it grabbed the user's attention.
Derivative Mode
While in the derivative mode, rather than using the range measurements themselves, the change between consecutive range measurements are mapped to the audio domain. Such a mapping provides greater information allowing for the detection of shapes/patterns and details of which are not necessarily noticeable in the proportional mode.
Two forms of this mapping were experimented with. With the absolute mapping, the absolute value of the change in range measurements was mapped to frequency (k = 4000Hz, c = 3.3, a = 1.9 and s = 1.2m) and/or amplitude. The n on-absolute mapping considered whether the change in range measurements is positive or negative. A positive change indicates the location being measured is farther away from the user relative to the last location (i.e. the current measurement is great er than the previous measurement). A negative change indicates that the location being measured is closer to the user (i.e. the current measurement is less than the previous measurement). Such information was conveyed using three different signals. As wit h the absolute mapping, a 200Hz (F1), low amplitude signal was output when there was no change between consecutive measurements. A 4000Hz (F2), signal was output when the change was negative, while a 2000Hz (F3), signal wa s output for a positive change. In addition, the amplitude of the two latter tones was varied inversely with the magnitude of the change in measurements.
Since there are no general guidelines for sonifying data [5], several different range-to-audio (or change in range to audio) mappings were experimented with. In the case of range to frequency, the output produced with a logarithmic ma pping was most effective as it stressed range measurements close-by, but allowed for a perceived change in frequency throughout the entire range. A modified version of the inverse square law was used to allow for a more uniform change throughout the entire range. Best results were achieved using a value of a = 140 and b = 0.3 with the proportional mode while a = 130 and b = 0.25 produced best results with the derivative mode.
Discussion
Informal lab surveys suggest that the output produced using the QTMA is both "musical" and effective in conveying information. Several subjects given only basic instructions and no training were able to quickly locate doorways and other depth discontinuities while in the proportional mode. In the derivative mode, subjects were able to detect corners and flat level surfaces as well as depth discontinuities however, some training was required.
Acknowledgements
The work was supported by a research grant from the National Science and Engineering Council of Canada (NSERC) and an NSERC summer research scholarship to B. Kapralos. We thank Prof. Patrick Dymond for suggesting the use of MIDI, Prof. Laurence Harris for suggesting the use of derivative mappings, and Robert Arrabito of DCIEM for his valuable comments and his encouragement. Greg Reid provided help with audio and signal processing facilities.
References
[1] Easton, D. Randolph. (1992): "Inherent Problems of Attempts to Apply Sonar and Vibrotactile Sensory Aid Technology to the Perceptual Needs of the Blind." Optometry and Vision Science 69 (1), 3-14.
[2] Heyes, D. Anthony. (1984). "The Sonic Pathfinder: A New Electronic Travel Aid." Journal of Visual Impairment and Blindness, 77, 200-202.
[3] Kay, Leslie. (1984). Acoustic Coupling to the Ears in Binaural Sensory Aids. Journal of Visual Impairment and Blindness, 77, 12-16.
[4] Nickerson S. B, P. Jasiobedzki, D. Wilkes, M. Jenkin, E. Milios, J. Tsotsos, A. Jepson, O.N.Bains: "An Autonomous Mobile Robot for known Industrial Environments.'' Robotics and Autonomous Systems, accepted, April 1998.
[5] Walker, N. Bruce and Gregory Kramer. "Mappings and Metaphors
in Auditory Displays: An Experimental Assessment." Proceedings
of the Third International Conference of Auditory Display. November
4-6, 1996.&n bsp; Palo Alto California.